Best loyalty tools and solutions in 2025
Download the report


Suppose you’ve just joined an iGaming brand to lead its marketing unit, and this is your first time cooperating with such a business. Learning the ins and outs of a new industry might be as challenging as it is exciting, unless you have a plan and colleagues who are ready to share their domain knowledge.
Besides familiarizing yourself with the industry landscape and the brand’s operations, you will need to understand key iGaming metrics. Insights into player-casino relationships will guide you towards effective marketing decisions, like how Google Maps helps a tourist in a foreign city. The key question is how and where you find these insights. To do this, you should team up with a data analyst and discuss how you can work together productively.
In this blog post, we’ll explore the metrics iGaming brands use to monitor their performance and interaction with customers. Next, we’ll give you a few ideas on how to leverage data to enhance player experiences, foster loyalty, and ultimately maximize customer lifetime value.
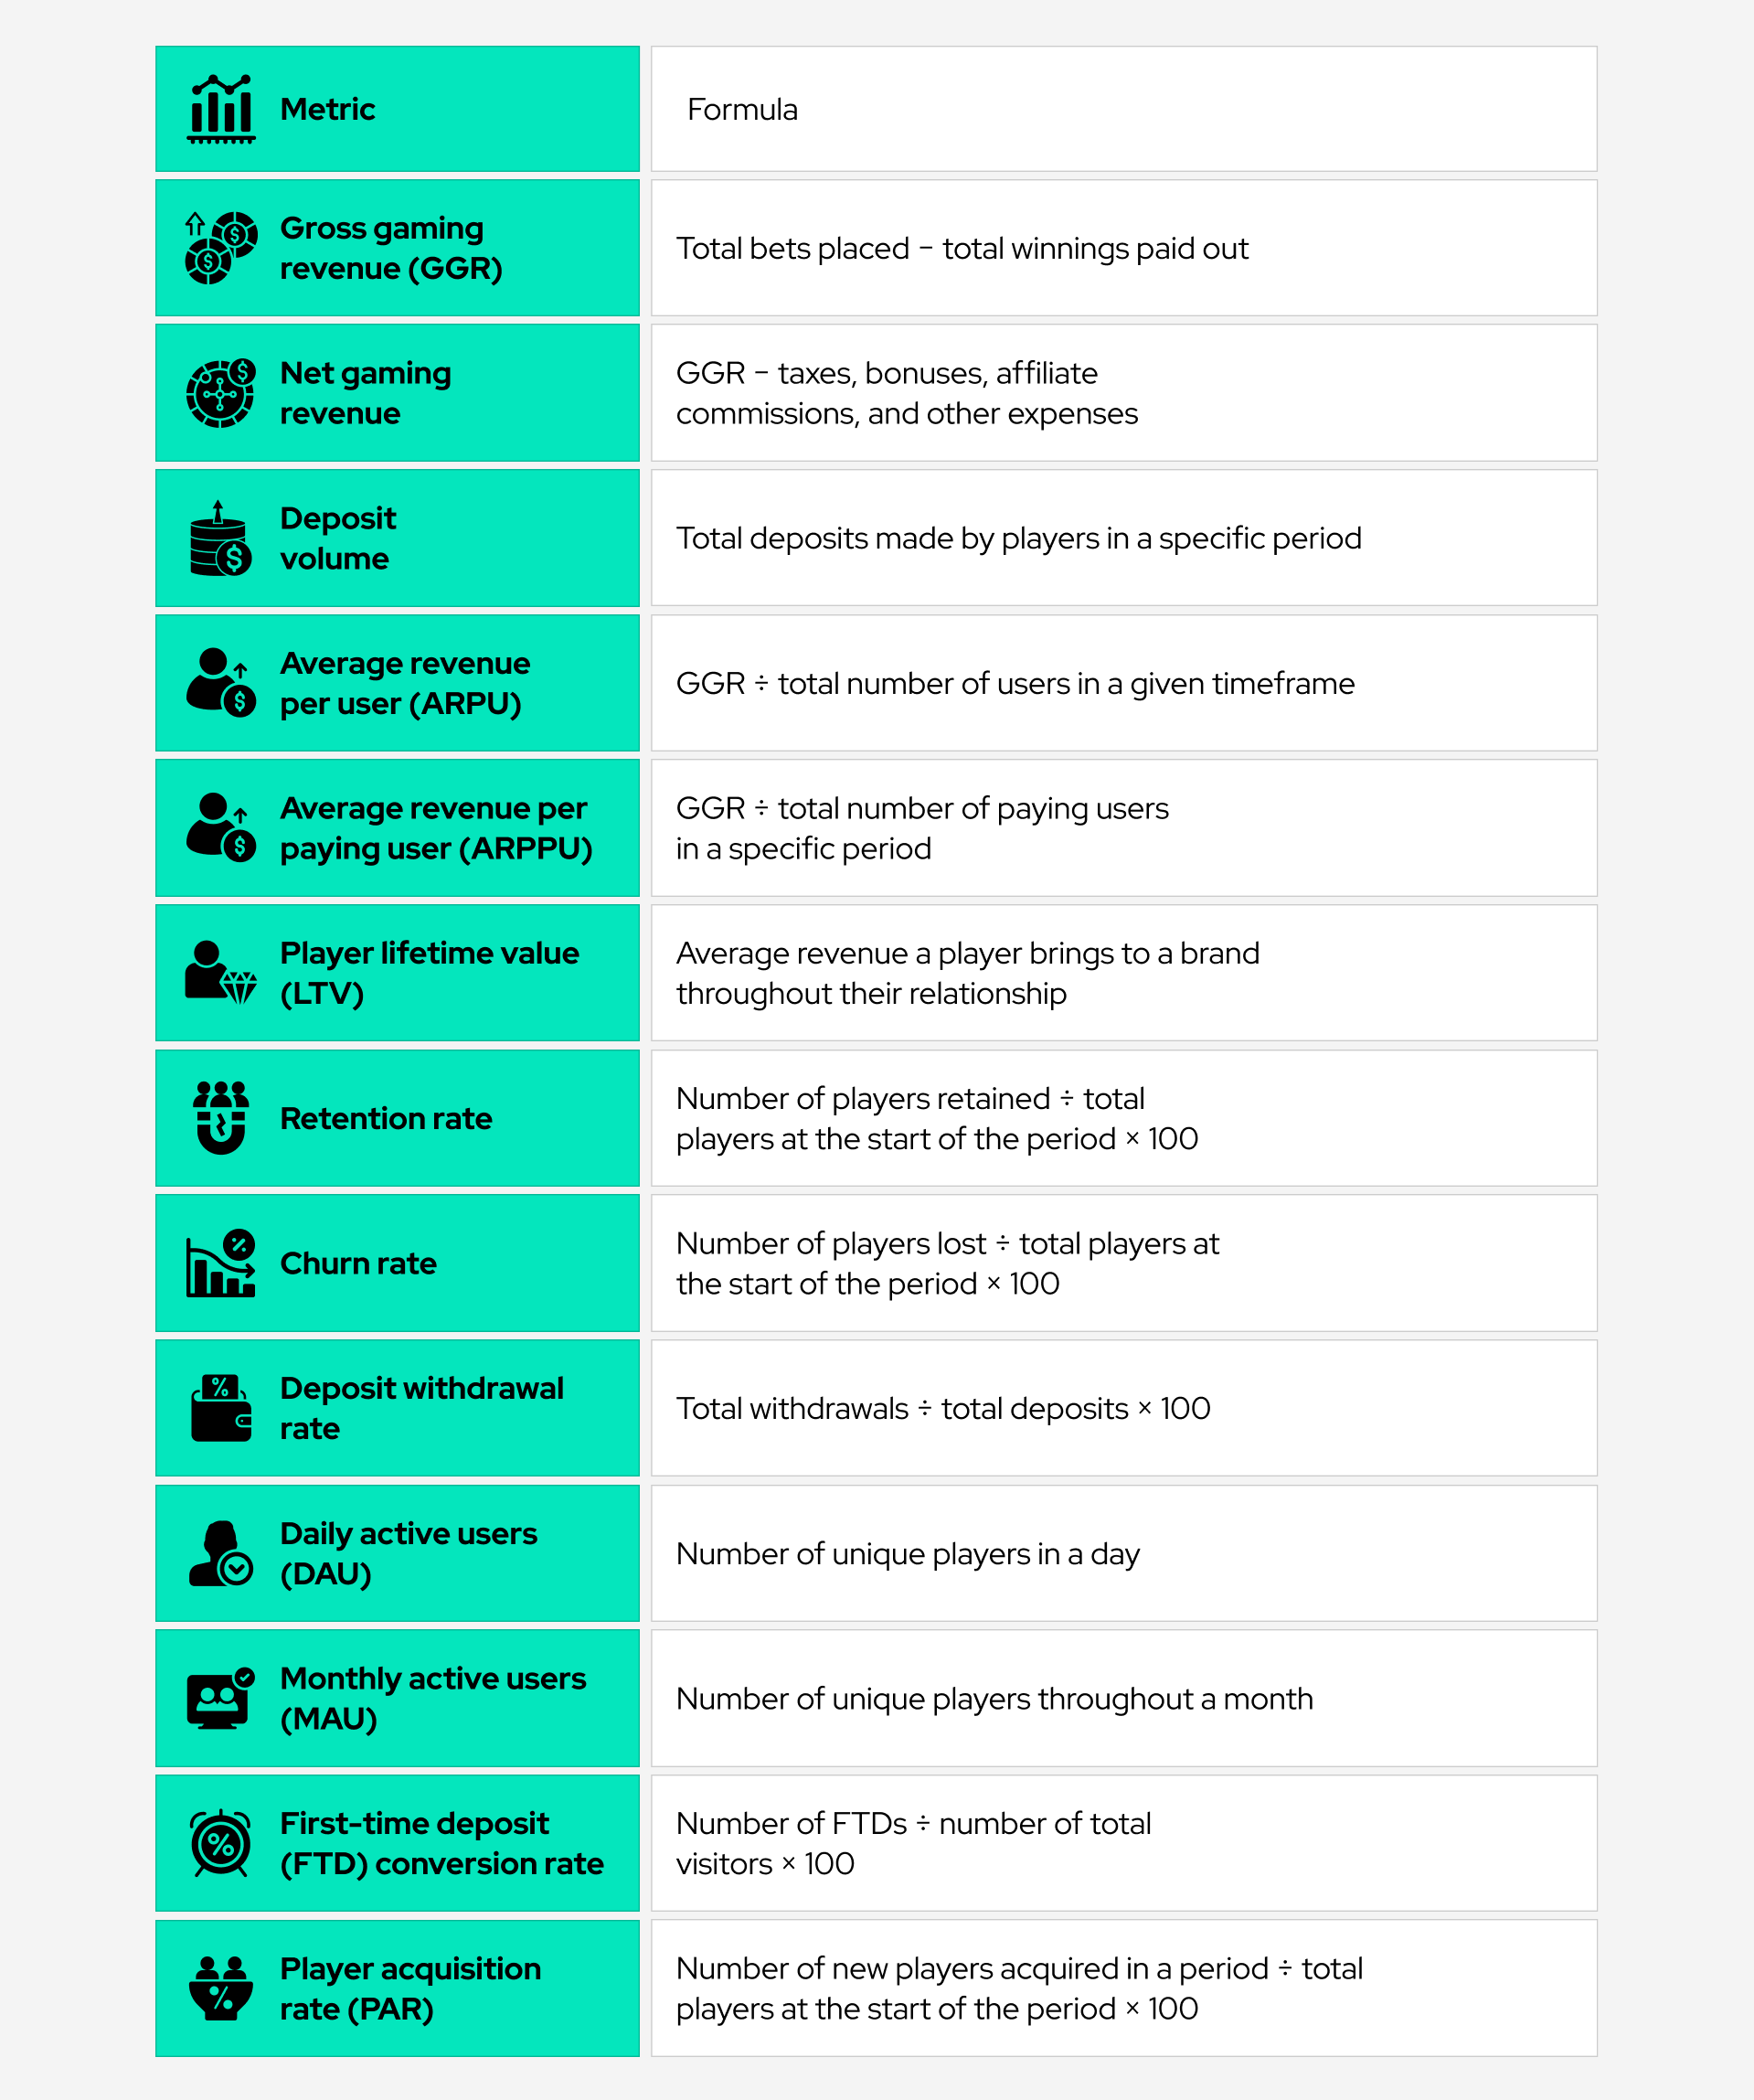
For easier comprehension, we’ve grouped the metrics into three categories: financial, player engagement, and marketing.
Gross gaming revenue (GGR) is one of the key metrics for assessing iGaming platforms’ performance. It represents earnings from bets, or customer losses, after subtracting winnings. For instance, if players wager $1,000,000 and win back $900,000, the GGR is $100,000.
Net gaming revenue (NGR) is casino profit, or the amount of money the business keeps after winnings, bonuses, chargebacks, and other operating expenses are deducted from GGR.
GGR and NGR provide a snapshot of the brand’s financial affairs. They tell us, in simple terms, where we stand right now. Other casino performance metrics reveal how we’ve arrived at our present position.
Deposit volume refers to the total amount of funds users deposit into their accounts within a specified timeframe. The metric reflects the frequency and size of deposits, which, in turn, illustrate payment patterns and overall financial activity on the platform.
Average revenue per user (ARPU) is calculated by dividing total revenue by the number of active customers. A drop in ARPU may be a sign that it’s time to review the bonus policy to get rid of bonus hunters or integrate new games to refuel players’ interest in the casino.
Average revenue per paying user (ARPPU), unlike the previous metric, focuses on players who deposit money and spend it on the platform.
Player lifetime value (LTV) is the expected total revenue generated over the entire relationship between a customer and an iGaming business.
The customer retention rate is the percentage of players who visit an iGaming website and continue to play games over a specified period. The metric measures a brand’s ability to keep its players engaged and earn their loyalty. A high retention rate is every casino’s dream (and goal) because it means steady revenue and savings on player acquisition and directly affects player lifetime value.
The customer churn rate, on the other hand, represents the percentage of players who leave the platform during the observed period.
The deposit withdrawal rate refers to the percentage of deposited funds that players cash out of their accounts. It illustrates the levels of player engagement and satisfaction with the platform.
Daily active users (DAU) and monthly active users (MAU) represent the overall player engagement and the popularity of the online casino.
If the brand acquires and retains players through livestreams, then average concurrent viewers, peak viewers, and player acquisition rate (PAR) may be useful.
iGaming businesses don’t need to reinvent the wheel when it comes to measuring the effectiveness of marketing efforts. Customer acquisition cost (CAC), return on marketing investment (ROMI), conversion rate, and return on ad spend (ROAD) have their place in reports. However, there is one industry-specific metric that you may regularly encounter.
The first-time deposit (FTD) conversion rate indicates the percentage of newly registered players who become paying customers by making an initial deposit. The metric illustrates the quality of acquired users, the efficacy of the platform’s onboarding methods, trustworthiness, and usability.
Now, let’s explore how you could use the information about user interactions with the platform to improve the bottom line for the iGaming business. For that, you will need to work closely with the data analyst.
You can segment players by how much they spend and tailor messaging and rewards. The data analyst would need to source the following data for a specified timeframe:
Possible segments are casual players, regulars, and VIPs, or high rollers. VIPs can get invitations to exclusive offline events with celebs and the largest bonuses, while casuals and regulars can receive smaller but frequent perks.
Clients’ game preferences naturally change over time — the thrill of novelty keeps them immersed. So, why not monetize games to the maximum while they are at their peak popularity?
Consider promoting the most-played games to the community across multiple channels and through various content types, such as:
To identify current top-performing games over a specific period, the data analyst will collect gaming session data. This data includes the number of unique players (aggregated DAU) for each game, wagering volume, and session duration — total and average time users spend playing each game.
Reactivating disengaged players is more financially feasible than acquiring new ones, given that CAC can reach several hundred dollars in the industry. To identify users who are likely to leave, the brand needs to rely on a predictive analytics tool. Such software is powered by machine learning models that track player engagement signals, such as:
Give players with high churn scores reasons to return to the platform. You can send a push notification, an email, or an SMS saying that the player is missed and season it with a personalized time-limited monetary bonus, free spins for their favorite game, or loyalty program tokens. Again, the incentive choice and size can be tied to the player’s past spending behavior.
The data analyst could provide you with access to the analytics tool or regularly update you on churning users. It all depends on how you decide to cooperate.
Effective marketing strategies are built on knowledge of player behavior and the operator's financial performance, and the data analyst is the one who can share this knowledge with you. Relying on these insights, you can shift from generic to segmented and personalized offers, create content that resonates with your audience, measure the impact of your efforts, and adjust strategies to achieve better results.